
Performance Analysis
Linaro Performance Reports: A High-Level View of Application Performance with Plain-English Insights
Linaro Performance Reports aggregates and analyzes data from a range of performance metrics to give a detailed overview of an application’s efficiency and scalability.
No source access needed
- Analyze and track a wide range of metrics, from execution time to resource utilization and throughput.
- Integrate reports into your CI/CD workflow without needing to access the source code.
- Use the report to identify potential bottlenecks and optimize performance.
One Page, Clear Advice
Each report shows where the run spent its time across compute, MPI and I/O, and explains what to look at first.
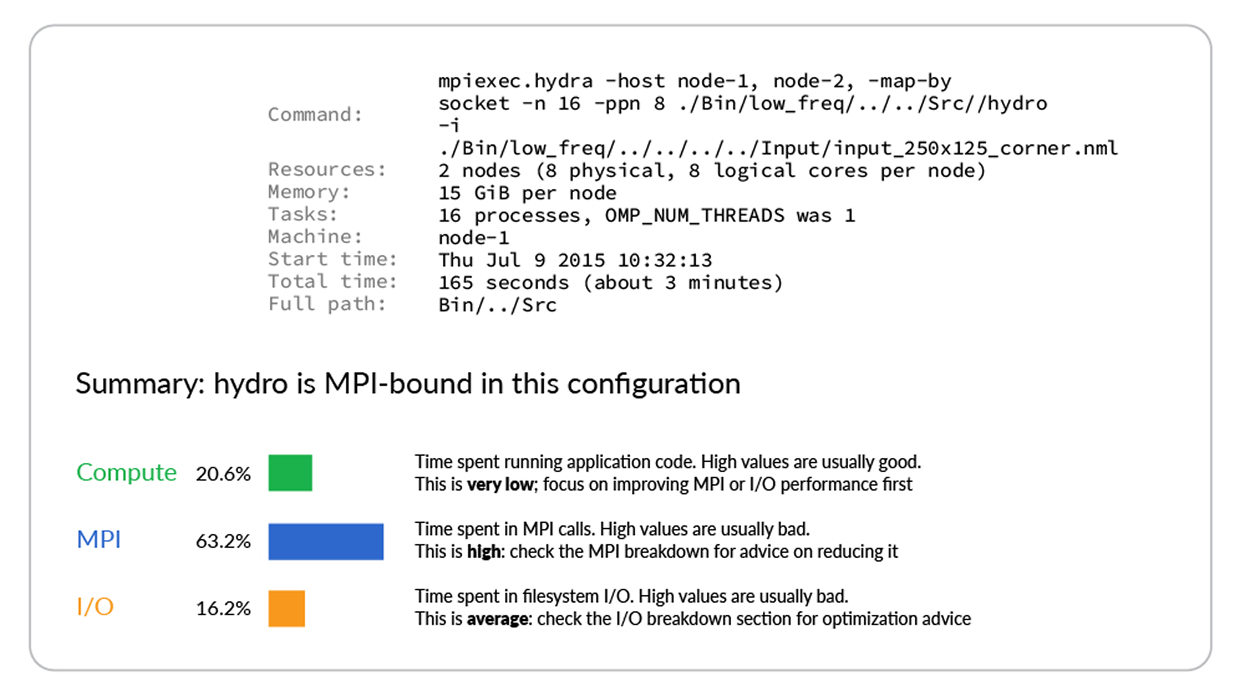
Linaro Performance Reports Metrics
Detailed breakdowns for CPU, MPI and I/O point to the next tool or change to try.
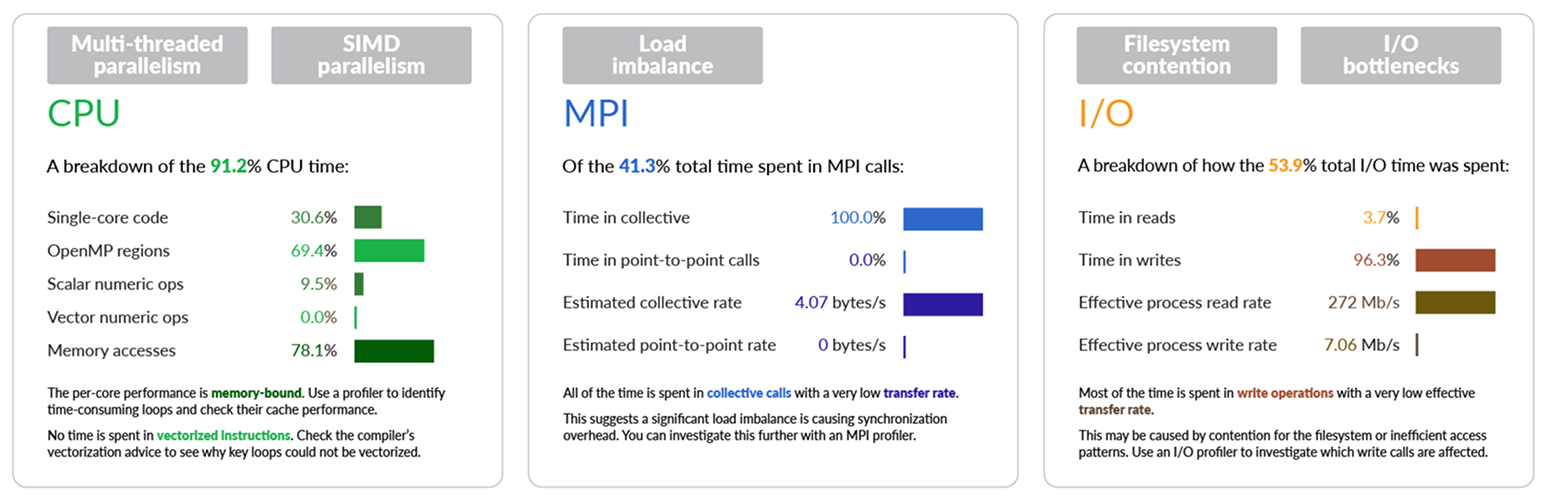
Get Ahead of the Competition
Applications must meet the demanding performance requirements of modern computing environments. Linaro Performance Reports helps by giving you hints and tips on where to focus your efforts.
Suitable for All Scales
As with all tools in the Linaro Forge suite, Linaro Performance Reports scales from single-process, single-threaded programs to parallel multithreaded applications running across thousands of nodes.
Intuitive and Easy to Use
Because each report explains its findings in detail, less expertise is needed to analyze performance and make informed decisions.
Part of the Linaro Forge Suite
When a report points to a problem, Linaro MAP and Linaro DDT take you to the cause.
Linaro MAP
Low-overhead profiling for threaded and parallel code, down to the source line.
Linaro DDT
Debug threaded and parallel C, C++, Fortran and Python code at any scale.
Linaro Forge Suite
See how debugging, profiling and reporting work together.
Get Linaro Performance Reports
Try Linaro Forge free for two weeks on up to 32 MPI ranks.