
Product Suite
Linaro Forge Product Suite
The complete toolkit for debugging, performance profiling, and automated performance reports across multi-node CPU and GPU clusters.
3 Core Tools
Linaro DDT, Linaro MAP and Linaro Performance Reports in one graphical and command-line environment for C, C++, Fortran, Python and GPU code.
Core Components of the Linaro Forge Suite
Linaro Forge brings together parallel debugging, low-overhead profiling, and automated performance reporting in one workflow.
Parallel Debugger
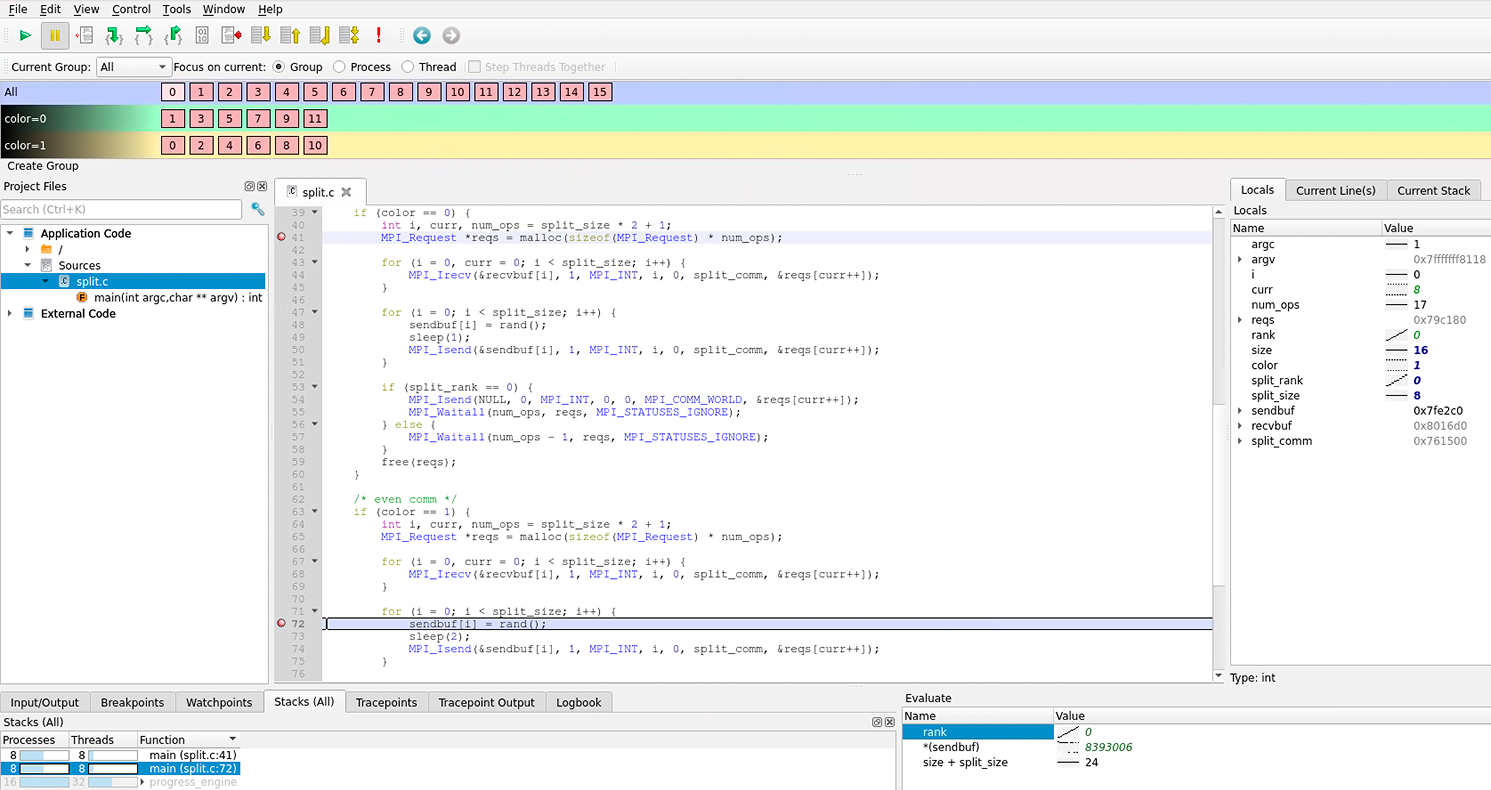
Linaro DDT
The number one debugger for C, C++, Fortran and Python threaded and parallel code, from single workstations to supercomputers.
- MPI, OpenMP, CUDA and ROCm debugging
- Memory leak and memory error detection
- Process groups and aggregated stacks across ranks
Performance Profiler
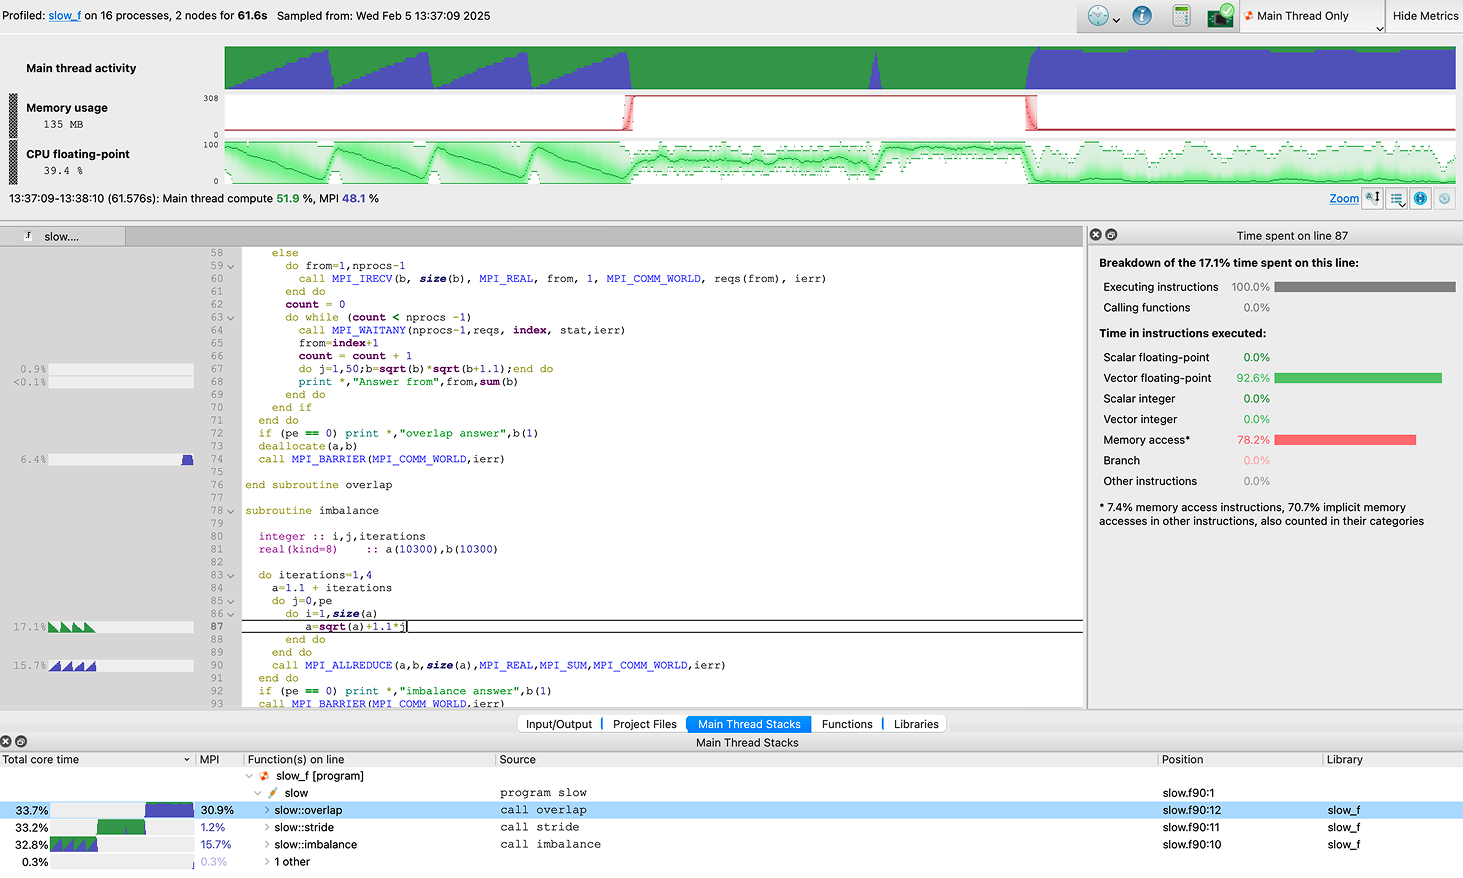
Linaro MAP
A low-overhead profiler that pinpoints bottlenecks in threaded and parallel code down to the source line.
- Typically under 5% runtime overhead
- MPI, Perf counter, I/O and memory metrics
- Source-line performance attribution
Performance Analysis
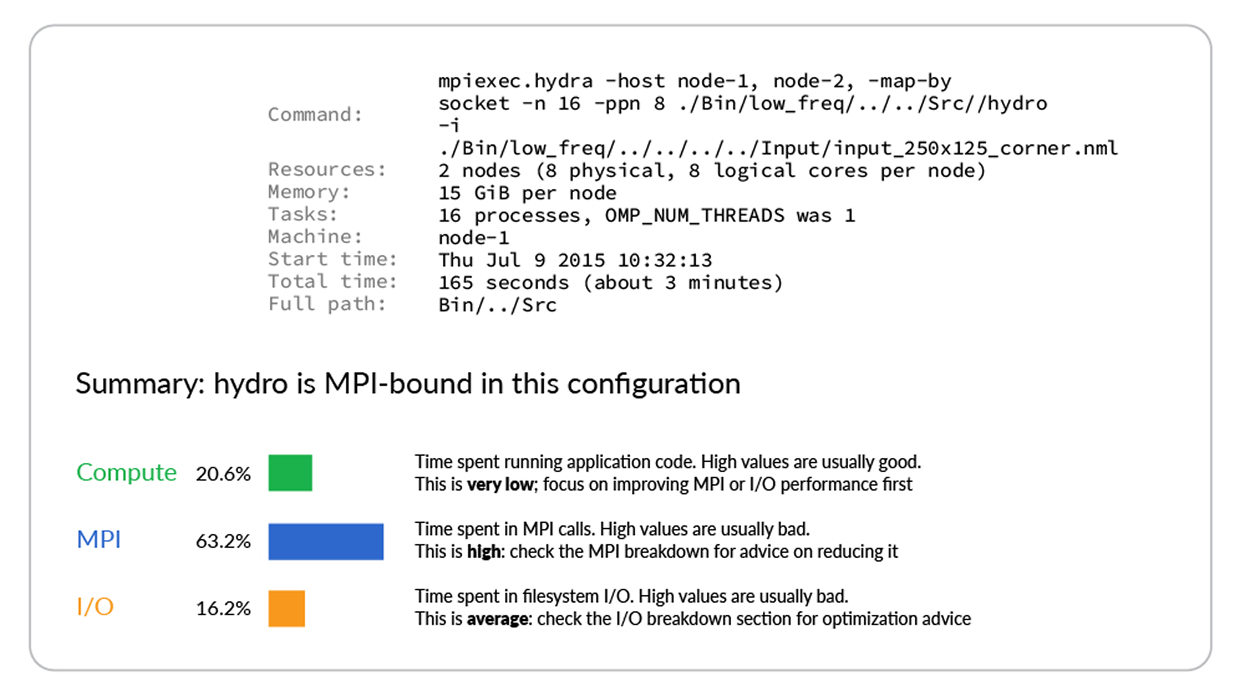
Linaro Performance Reports
One-page performance summaries with plain-English advice for developers and cluster managers.
- Compute, MPI and I/O time breakdown
- Actionable optimization recommendations
- CI/CD integration without source code access
Key Technical Capabilities
Engineered for parallel concurrency, complex memory hierarchies, and multi-vendor hardware.
Multi-Architecture Hardware Support
Run on x86-64 and 64-bit Arm CPUs alongside NVIDIA GPUs (CUDA) and AMD GPUs (ROCm).
Graphical and Command-Line Interfaces
Use the desktop GUI for interactive debugging and profiling, or automate profiling and memory checks in Slurm and PBS batch scripts from the command line.
Remote Debugging over SSH
Debug and profile remote supercomputers and cloud GPU nodes from a GUI on your own machine, without forwarding X11 graphics.
Scales from One Process to Thousands of Nodes
Every tool in the suite scales from single-process, single-threaded programs to parallel multithreaded applications running across thousands of nodes.
Why Linaro Forge
Battle-tested for more than twenty years by the world’s most demanding computing centres.
Extreme Scalability
Linaro Forge works where other tools simply can’t go. Debug hundreds of thousands of processes in one Linaro DDT session, and profile production-sized runs with typically under 5% overhead.
Deep Cross-Platform Support
Built on years of partnership and integration with hardware vendors. One toolset across x86-64 and Arm CPUs and NVIDIA and AMD GPUs, so you don’t need a different tool for each system.
Built for Domain Experts
A clear graphical interface shows what every process is doing, so scientists and model builders can find problems themselves, without needing to be computer scientists.
Experience Linaro Forge on Your Clusters
Try Linaro Forge free for two weeks on up to 32 MPI ranks, and see how Linaro DDT, Linaro MAP and Linaro Performance Reports speed up your software.