
Parallel Debugger
Linaro DDT: The Number One Debugger for C, C++, Fortran and Python Threaded and Parallel Code
Linaro DDT is an advanced debugger designed to simplify the troubleshooting and optimization of HPC applications.
MPI · OpenMP · CUDA · ROCm
- Debug parallel, multithreaded, and distributed HPC applications.
- Identify bugs, memory leaks, and correctness issues through an intuitive graphical interface.
- Work across programming models such as MPI, OpenMP, CUDA and ROCm.
See Every Process at Once
Group MPI ranks, compare variables across processes, and step threads together from a single window, whether you are debugging one workstation or thousands of nodes.
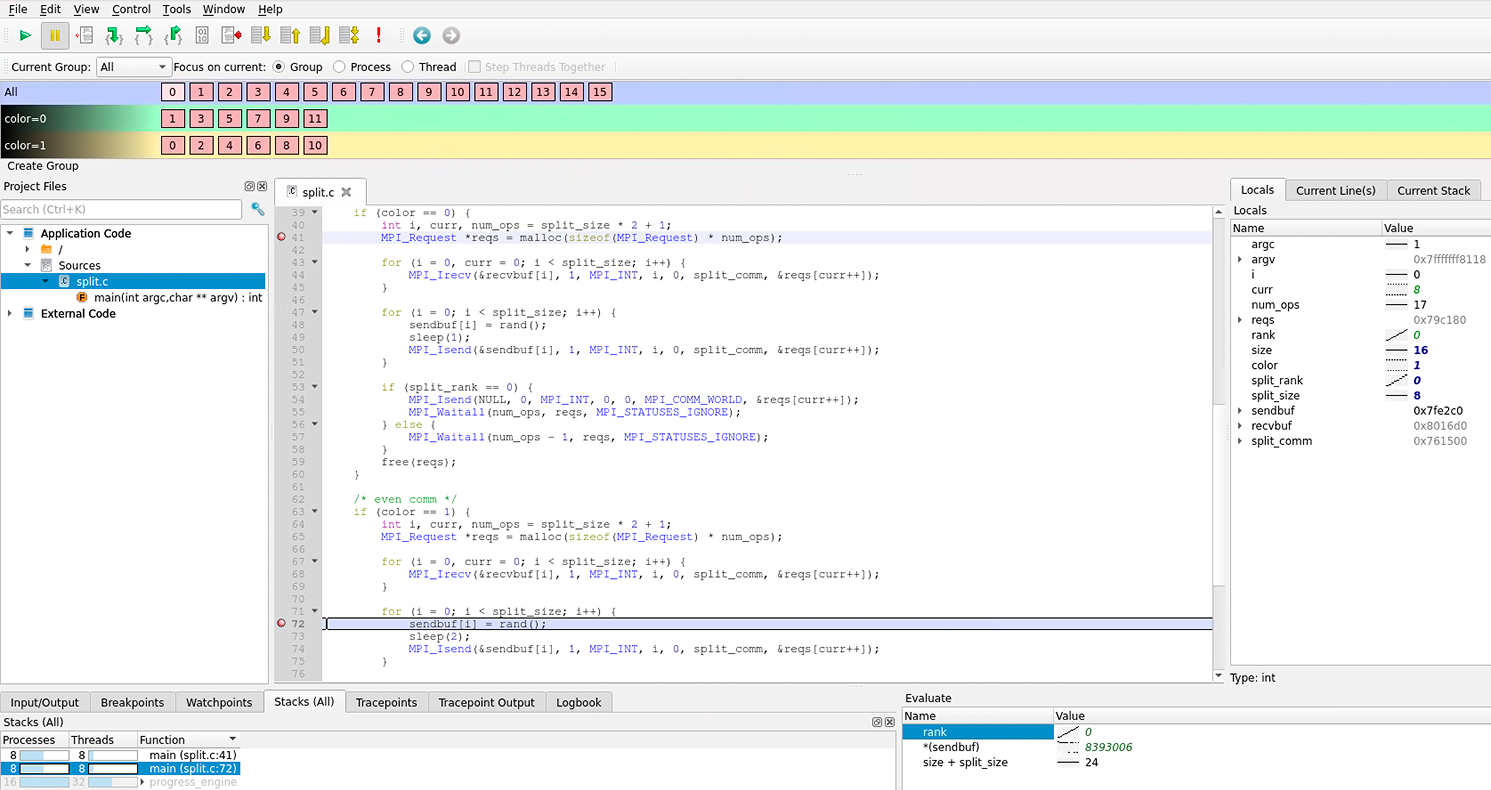
Learn Fast & Save Time
Linaro DDT’s powerful, intuitive GUI takes the complexity out of debugging software through its array of visualizations, enabling you to quickly get up to speed and save precious time.
Work Across Platforms
Linaro DDT supports x86-64 and 64-bit Arm CPUs alongside NVIDIA and AMD GPUs, allowing you to stay productive at all times.
Talk to Our Debugging Experts
Once you start using Linaro DDT, you gain access to training materials and direct email access to our support team, so you keep up to date with debugging best practices.
With Arm DDT, debugging is fast and enjoyable. It’s easy to just pick up; it is outstanding for debugging multithreaded and parallel software.
Neil Catling, Chief Software Scientist, CGG
Part of the Linaro Forge Suite
Linaro DDT works alongside Linaro MAP and Linaro Performance Reports in the same environment.
Linaro MAP
Low-overhead profiling for threaded and parallel code, down to the source line.
Linaro Performance Reports
A one-page view of application performance with plain-English advice.
Linaro Forge Suite
See how debugging, profiling and reporting work together.